Products ECG, for everyday wear.
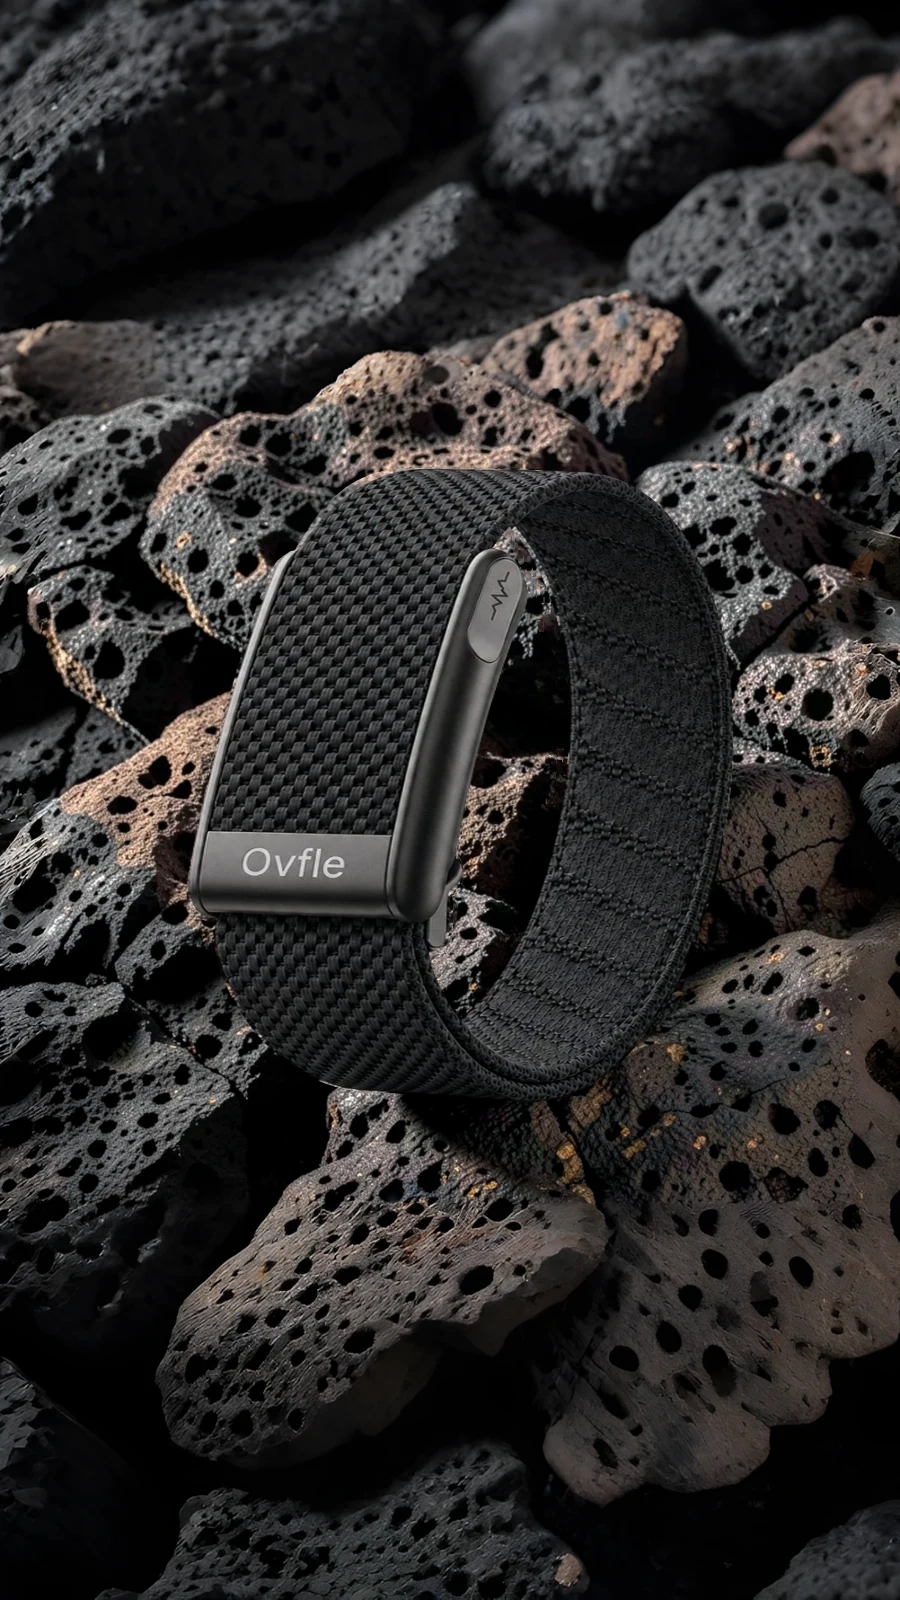
WP-1 Screen-free tracking with ECG capability, a woven strap and a slim housing.
Retail price 54.99 US dollars US$ 54.99
Not sold directly on this website.
ECG capability Screen-free design 125 mAh battery Up to 15 days of normal use Illustrative data. Not live readings or medical results.
ECG An example ECG waveform and its recorded measurements.
Example display ECG waveform Pixel-derived vector recreation of the supplied 17_ecg_waveform.png chart. This is a visual reference trace, not raw clinical data. 0S 1S 2S Recorded interface example · Illustrative display, not a diagnosis
♥ Heart Rate 77 bpm Avg. HR 82 bpm Max. HR 70 bpm Min. HR 100.0% Normal 0.0% Fast 0.0% Slow
♥ HRV HRV0 ~ 210 ms 72
SDNN102 ~ 180 ms 242 ↑
RMSSD15 ~ 39 ms 228 ↑
▣ ECG QTc260 ~ 440 ms 385
QRS Amplitude0.05 ~ 1.5 mV 0.87
QRS Duration80 ~ 120 ms 88
QRS DirectionUpward, Downward Upward
ST Amplitude−0.05 ~ 0.1 mV 0.02
Example display only. These values have not been clinically validated and should not be used for medical decisions.
Heart Rate See how heart rate changes across a training day.
Simulated demonstration data Heart Rate Trend Source: 02_heart_rate_trend.png; exact source card crop 36,441,1248,1183. Vector reconstruction. Values are source values and are replaceable using data-field attributes; source data is not a clinical claim. Fixed label glyphs traced from source; editable values use embedded Liberation Sans, regular and bold. 18:00–18:59 180 105 30 Interval average Daily average (24 h) Heart Rate Minmax Source: 02_heart_rate_trend.png; exact source card crop 36,1846,1248,324. Vector reconstruction. Values are source values and are replaceable using data-field attributes; source data is not a clinical claim. Fixed label glyphs traced from source; editable values use embedded Liberation Sans, regular and bold. Illustrative heart-rate bands
≥140 bpm 3.1%
110–139 bpm 1.0%
80–109 bpm 9.4%
60–79 bpm 71.9%
<60 bpm 14.6% Numeric bands only. Not a resting, training or clinical classification.
HRV Compare interval readings with the daily average.
Simulated demonstration data {"source_frame": "14", "source_crop": [36, 441, 1284, 1624], "source_pixel_geometry": true, "static_typography": "Vector outlines traced from source screenshot", "dynamic_typography": "Editable SVG text: original font unavailable; fallback approximates shape. textLength preserves original numeric width; update for longer values.", "apnea_legend": null, "plot_bounds_global": [90, 718, 1146, 1312], "plot_bounds_local": [54, 277, 1110, 871], "axis_values_top_to_bottom": [120, 80, 40, 0], "source_axis_nonuniform": false} 20:00–20:14 {"source_frame": "14", "source_crop": [36, 1660, 1284, 1984], "source_pixel_geometry": true, "static_typography": "Vector outlines traced from source screenshot", "dynamic_typography": "Editable SVG text: original font unavailable; fallback approximates shape. textLength preserves original numeric width; update for longer values.", "apnea_legend": null} Simulated HRV values in milliseconds, independent of the heart-rate example.
Blood Oxygen Blood oxygen readings across the day.
Simulated demonstration data {"source_frame": "07", "source_crop": [36, 441, 1284, 1753], "source_pixel_geometry": true, "static_typography": "Vector outlines traced from source screenshot", "dynamic_typography": "Editable SVG text: original font unavailable; fallback approximates shape. textLength preserves original numeric width; update for longer values.", "apnea_legend": "Preserved source legend. Source-unverified; no medical inference.", "plot_bounds_global": [90, 744, 1146, 1338], "plot_bounds_local": [54, 303, 1110, 897], "axis_values_top_to_bottom": [100, 94, 70], "source_axis_nonuniform": true} 20:00–20:14 {"source_frame": "07", "source_crop": [36, 1975, 1284, 2299], "source_pixel_geometry": true, "static_typography": "Vector outlines traced from source screenshot", "dynamic_typography": "Editable SVG text: original font unavailable; fallback approximates shape. textLength preserves original numeric width; update for longer values.", "apnea_legend": "Preserved source legend. Source-unverified; no medical inference."} Illustrative SpO₂ readings. Not a medical assessment.
Activity Daily activity, sleep duration and a workout summary, presented together.
Synthetic training-day demo activity overview Synthetic display values. Original App layout; not measured athlete results or device-validation evidence. {"source_layout": "activity-overview", "display_data": {"source": "synthetic training-day illustration, not athlete measurements", "steps": 12480, "goal": 15000, "distance_km": 9.36, "estimated_active_kcal": 620, "sleep_minutes": 468, "workout_minutes": 60, "workout_active_kcal": 480, "workout_average_hr": 142, "workout_time": "18:00\u201319:00", "distance_basis": "Illustrative 0.75 m per step; not a device conversion formula", "calorie_basis": "Workout 480 kcal included in daily 620 kcal; illustrative estimates, no algorithm claim"}} kcal km activity level Synthetic display values. Original App layout; not measured athlete results or device-validation evidence. {"source_layout": "activity-level", "display_data": {"source": "synthetic training-day illustration, not athlete measurements", "steps": 12480, "goal": 15000, "distance_km": 9.36, "estimated_active_kcal": 620, "sleep_minutes": 468, "workout_minutes": 60, "workout_active_kcal": 480, "workout_average_hr": 142, "workout_time": "18:00\u201319:00", "distance_basis": "Illustrative 0.75 m per step; not a device conversion formula", "calorie_basis": "Workout 480 kcal included in daily 620 kcal; illustrative estimates, no algorithm claim"}} Training day demo 12,480 steps Goal: 15,000 steps sports record Synthetic display values. Original App layout; not measured athlete results or device-validation evidence. {"source_layout": "sports-record", "display_data": {"source": "synthetic training-day illustration, not athlete measurements", "steps": 12480, "goal": 15000, "distance_km": 9.36, "estimated_active_kcal": 620, "sleep_minutes": 468, "workout_minutes": 60, "workout_active_kcal": 480, "workout_average_hr": 142, "workout_time": "18:00\u201319:00", "distance_basis": "Illustrative 0.75 m per step; not a device conversion formula", "calorie_basis": "Workout 480 kcal included in daily 620 kcal; illustrative estimates, no algorithm claim"}} mins kcal bpm Demo data · Workout 18:00–19:00. Estimated workout calories are included in the daily total.
Stress Explore how an example stress score changes through the day.
Simulated demonstration data {"source_frame": "29", "source_crop": [36, 409, 1284, 1724], "source_pixel_geometry": true, "static_typography": "Vector outlines traced from source screenshot", "dynamic_typography": "Editable SVG text: original font unavailable; fallback approximates shape. textLength preserves original numeric width; update for longer values.", "apnea_legend": null, "plot_bounds_global": [90, 715, 1146, 1309], "plot_bounds_local": [54, 306, 1110, 900], "axis_values_top_to_bottom": [100, 80, 60, 40, 20, 0], "source_axis_nonuniform": false} 20:00–20:29 1–29 {"source_frame": "29", "source_crop": [36, 1946, 1284, 2269], "source_pixel_geometry": true, "static_typography": "Vector outlines traced from source screenshot", "dynamic_typography": "Editable SVG text: original font unavailable; fallback approximates shape. textLength preserves original numeric width; update for longer values.", "apnea_legend": null} Illustrative score distribution
1–29 62.5%
30–59 31.3%
60–79 6.2%
80–99 0.0% Numeric bands only. Not a resting, training or clinical classification.
Temperature Hourly readings, daily average and range.
Demo data Temperature Trend Source: 12_temperature.png; exact source card crop 36,409,1248,1036. Vector reconstruction. Values are source values and are replaceable using data-field attributes; source data is not a clinical claim. Fixed label glyphs traced from source; editable values use embedded Liberation Sans, regular and bold. Temperature Minmax Source: 12_temperature.png; exact source card crop 36,1847,1248,339. Vector reconstruction. Values are source values and are replaceable using data-field attributes; source data is not a clinical claim. Fixed label glyphs traced from source; editable values use embedded Liberation Sans, regular and bold. Illustrative readings · 00:00–23:00, hourly. Not a medical assessment.
Extra details
Battery capacity 125 mAh
Device dimensions 40.5 × 25 × 9 mm
Construction Zinc-alloy frame · ABS + PC case
Water resistance IP68 · 5 ATM
ECG Available
Battery life — normal use Up to 15 days
Battery life — continuous monitoring Up to 7 days
Charging Magnetic charging
Bluetooth 5.4
Compliance CE · FCC · RoHS Battery life varies with settings, usage and operating conditions.
Specifications & guidance Heart rate, HRV, sleep, nap, SpO₂, temperature and activity tracking are supported. Notifications use vibration. Follow the model care instructions; avoid hot showers and saunas. Readings are for general wellness information, not diagnosis or treatment decisions. ECG information does not replace professional medical assessment.
Compare Models Side by side
Find your fit. Model WP-1 WP-1 Active AIRPULSE Best suited to Everyday tracking + ECG Longer battery life Lightweight, sport-focused wear ECG Available No Available Normal use Up to 15 days Up to 50 days Up to 15 days Continuous monitoring Up to 7 days Up to 15 days Up to 7 days Wearing details Woven strap · slim housing Bound-edge weave · distinct housing Splash-resistant weave · anti-slip band Price (USD) Retail price 54.99 US dollars US$ 54.99 Retail price 39.99 US dollars US$ 39.99 Retail price 59.99 US dollars US$ 59.99
WP-1 Retail price 54.99 US dollars US$ 54.99 Everyday tracking + ECG
ECG Available
Normal use Up to 15 days
Continuous monitoring Up to 7 days
Wearing details Woven strap · slim housing View WP-1
WP-1 Active Retail price 39.99 US dollars US$ 39.99 Longer battery life
ECG No
Normal use Up to 50 days
Continuous monitoring Up to 15 days
Wearing details Bound-edge weave · distinct housing View WP-1 Active
AIRPULSE Retail price 59.99 US dollars US$ 59.99 Lightweight, sport-focused wear
ECG Available
Normal use Up to 15 days
Continuous monitoring Up to 7 days
Wearing details Splash-resistant weave · anti-slip band View AIRPULSE Battery life varies with settings, usage and operating conditions. AIRPULSE’s 10 g body weight excludes the strap.
For general wellness information only. This is not a medical device; readings are not a diagnosis or a substitute for professional medical advice.
 OVFLEZONIX